Laboratory tests
Our spectrograph was first assembled and tested in the lab in
Poznan Observatory cellar. The tests demonstrated proper collimation
and focusing with no stray light between spectral orders (Fig. 5). This
leaves open future option of recording two interleaved spectra at once,
e.g. for calibration purposes. Arc lines at 6500 A yield instrumental
profile of our spectrograph with FWHM =2 pixels i.e. 0.2 A or 8.5
km/s, corresponding to resolution R=33000 (Fig. 4). Thus resolution of
our spectrograph is consistent with the original design.
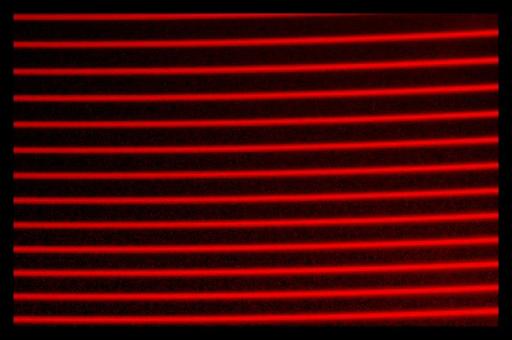
Fig. 1. Subset of the flat field lamp
spectrum. We use a standard wolfram lamp, producing a thermal emission. A
significant curvature of orders can be easily noticed. The color is artificial.
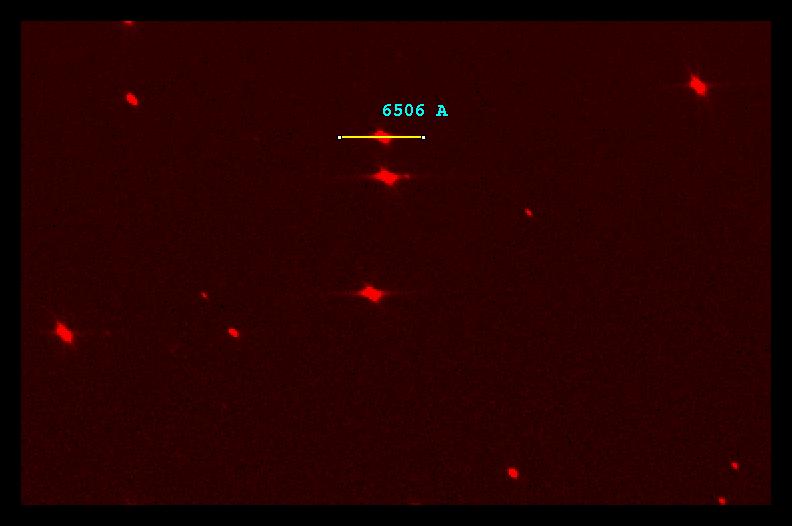
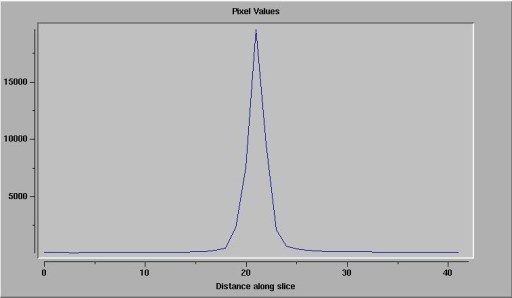
Fig. 4. The instrumental profile in the
direction of dispersion, as demonstrated by the cross section of the 6506 A line of Ne lamp, marked in
Fig. 2. Its FWHM=2 pixels
corresponds to 0.2 Angstroms or 8.5 km/s. This yields a resolving power
R=33000.
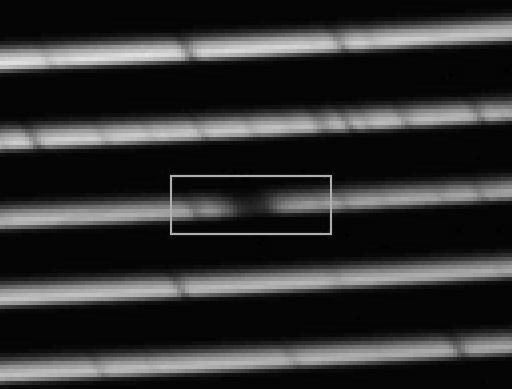
Fig. 5. Fragment of the daylight solar spectrum obtained by directly feeding the sun rays into the fiber. In Figs. 6, 7 we compare a marked fragment of this well exposed, high S/N spectrum with solar atlas around H alpha.
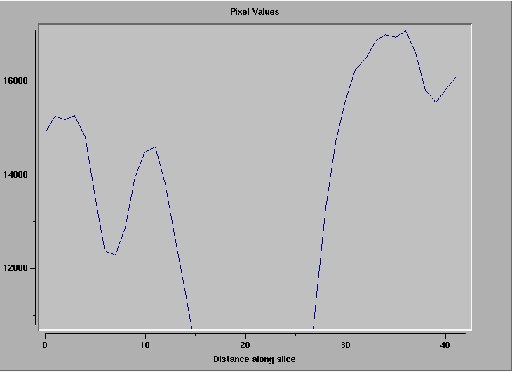
Fig. 6. A cross section through the Balmer H
alpha line from our solar spectrum (Fig. 5). The plot is about 4 A wide.
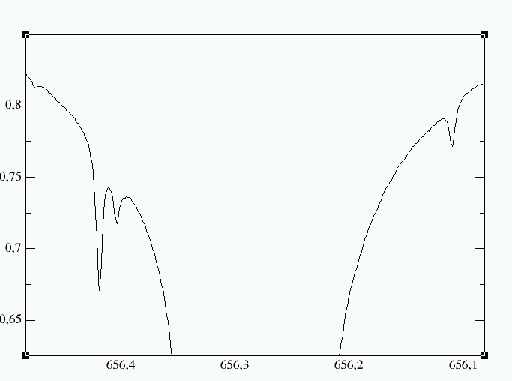
Fig. 7. The fragment of the solar atlas spectrum, scaled to match Fig. 6. The wavelength is given in nanometers. Notice the double line at the left, with components separated by 0.15 A unresolved in our spectrum, having the instrumental FWHM of 0.2 A.